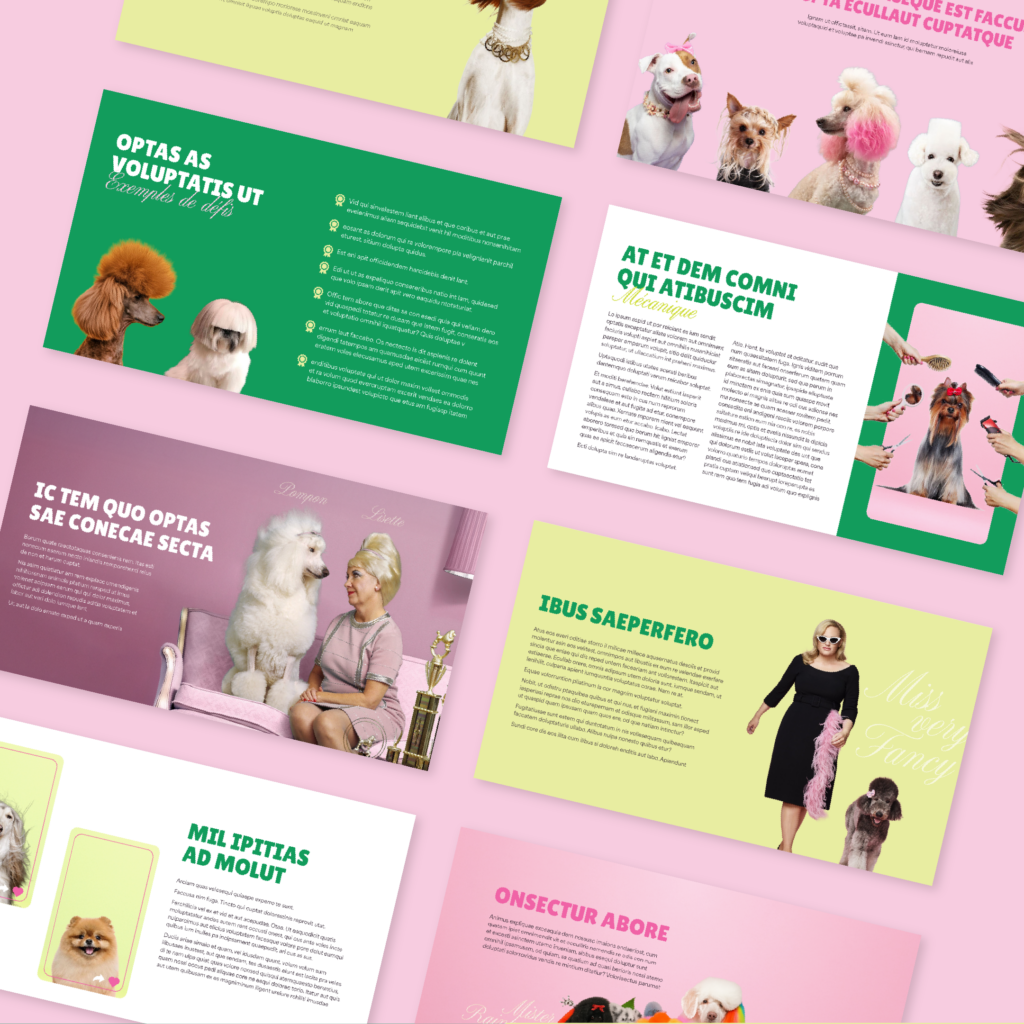
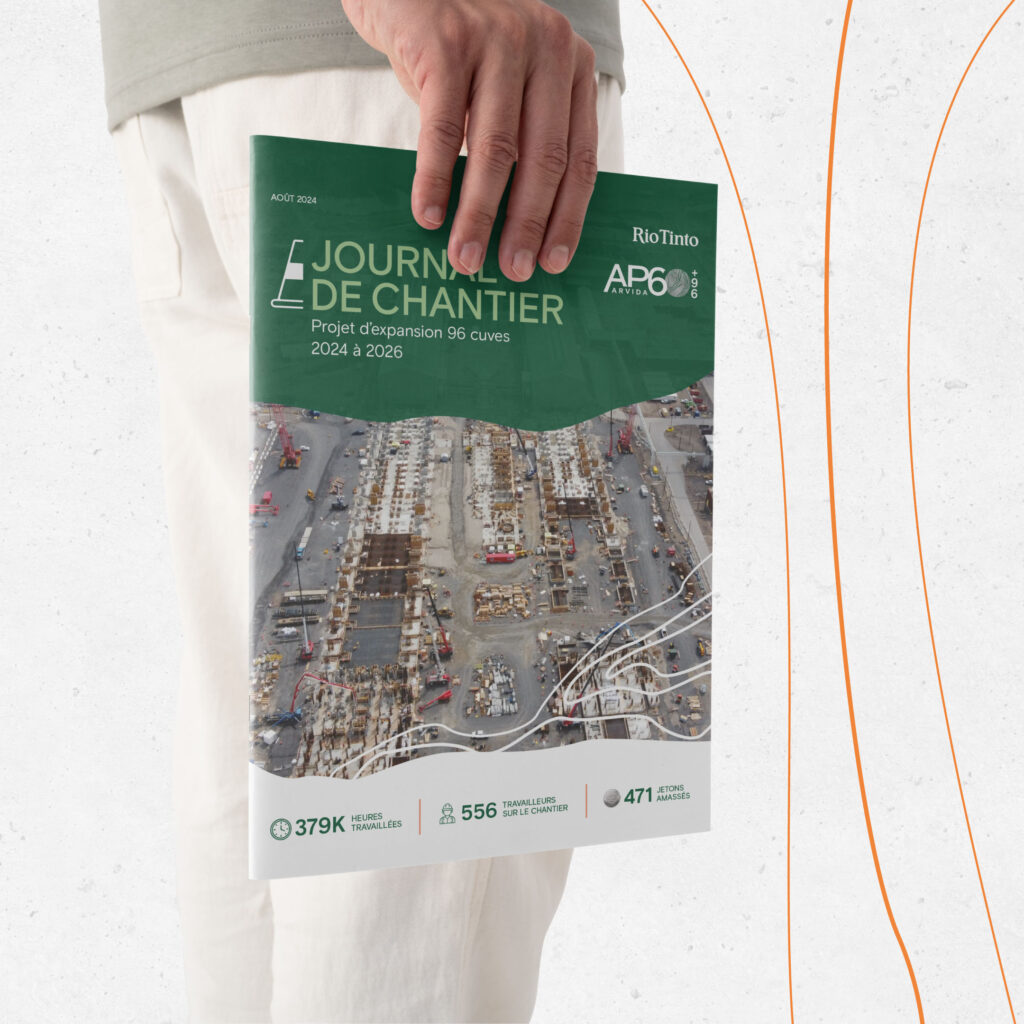
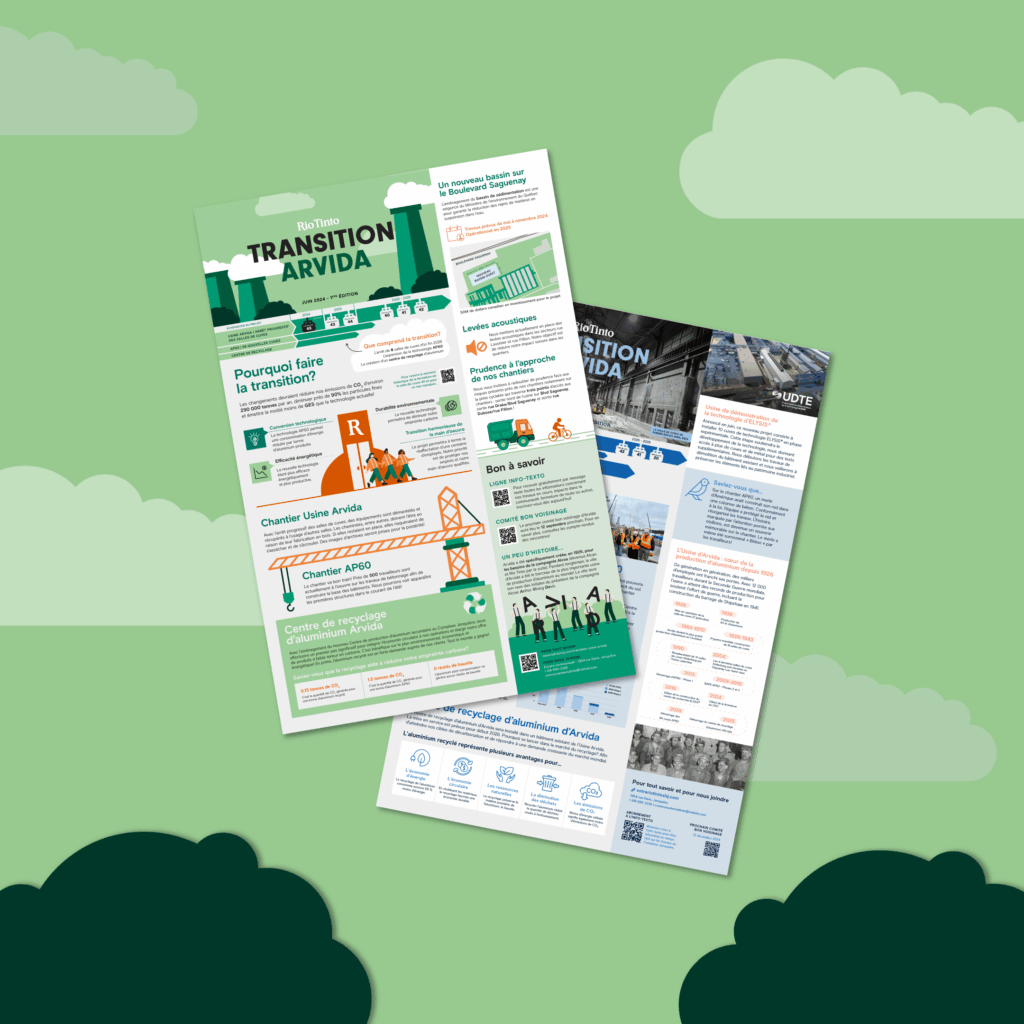
An annual report, a guide or a study often holds a lot of important information. Information design organizes it, makes it visual and pleasant to read, without losing any rigour.
What we produce
Annual reports, guides, studies, training workbooks, infographics, tables and diagrams, in print and accessible PDF. We designed the layout, infographics and art direction of Indigenous Clean Energy’s Clean Electricity Project Equity Guide.
Clarity first
We start with structure: heading levels, call-outs, data to visualize. Then we build a consistent template that makes updates and future editions easier.
FAQ
Can you turn data into infographics?
Yes. You provide the figures, we propose the best way to show them.
Can the document be bilingual?
Yes. We plan the layout for English and French, and other languages when needed.